
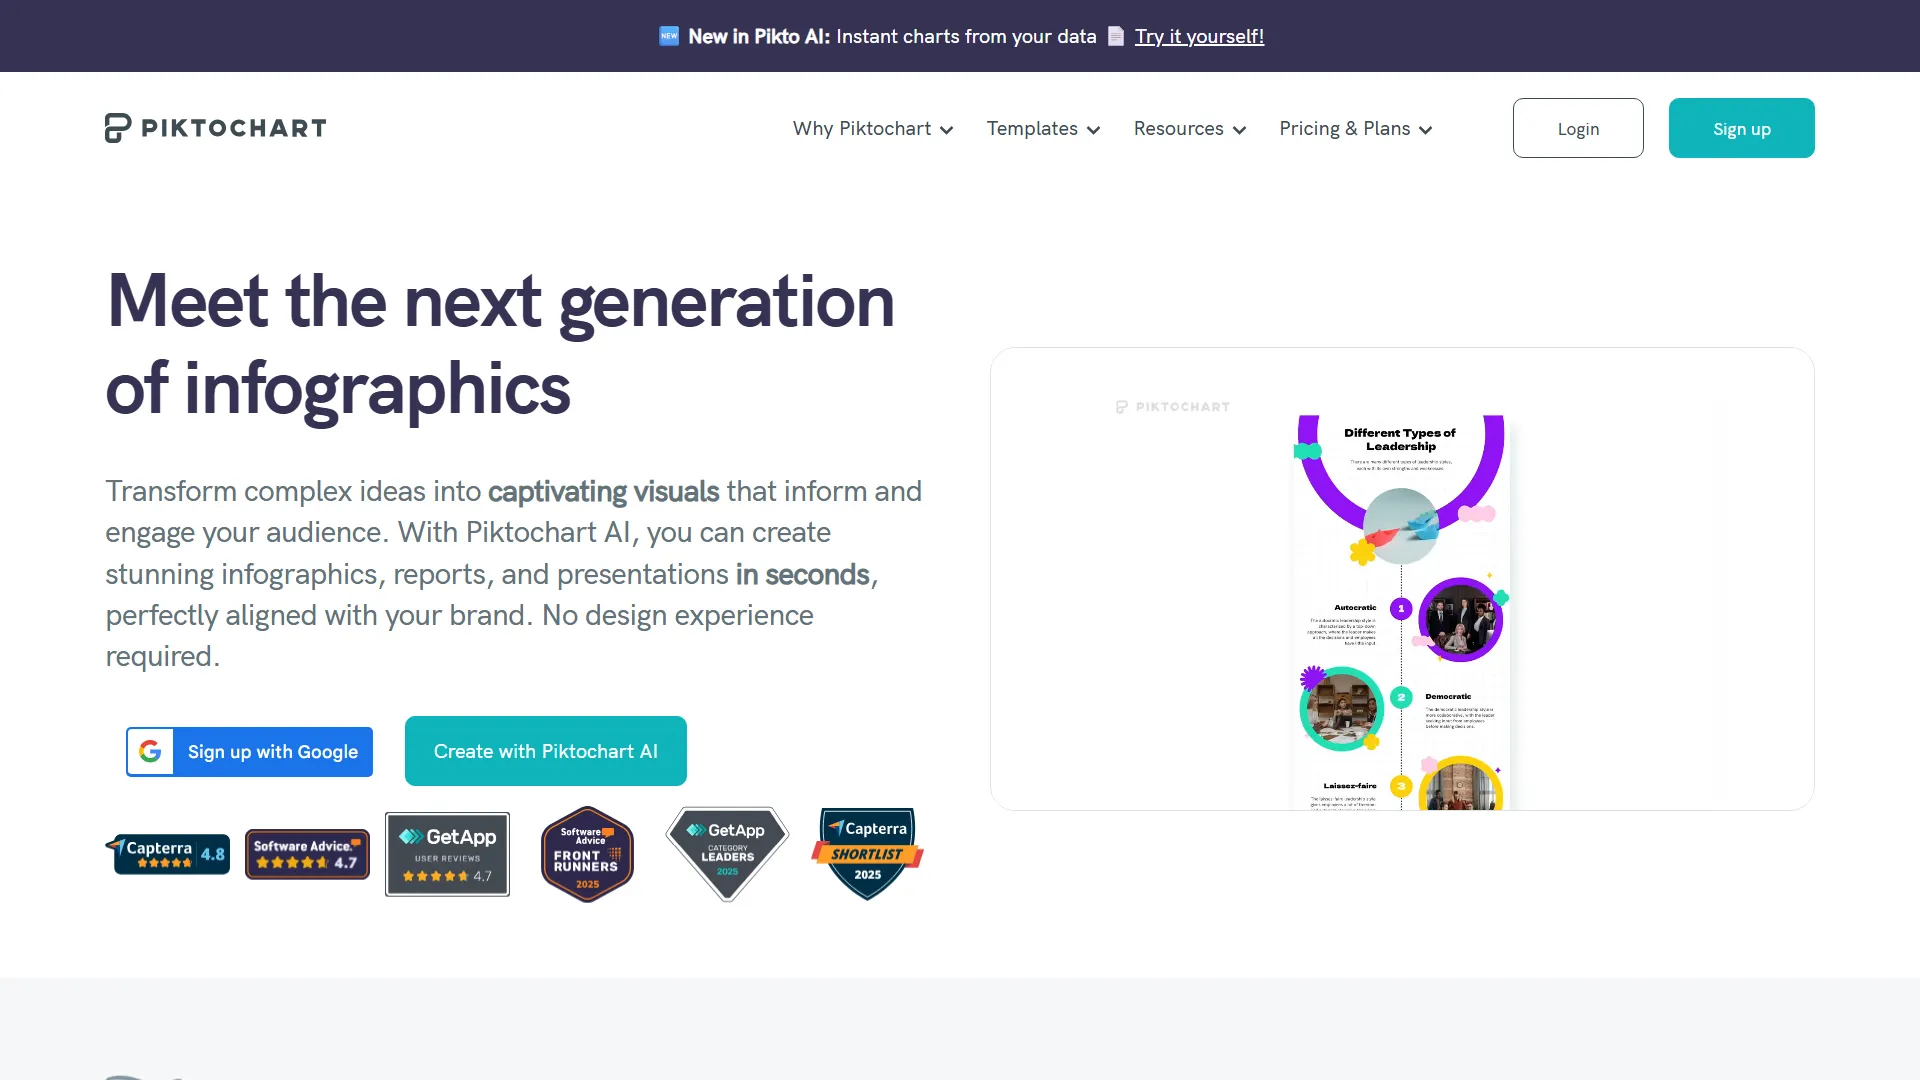
Intuitive tool for infographics, charts and visual reports
Home | Piktochart
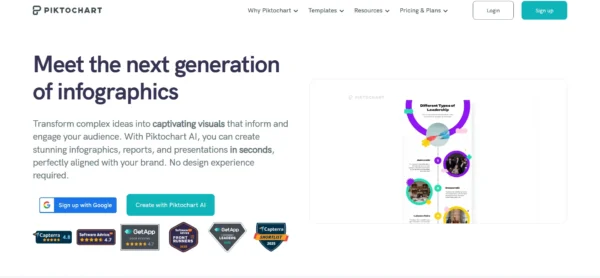
Struggling to visualise your data?
Piktochart helps anyone create infographics, reports and presentations with ease.
A teacher imports data → drags chart widgets → exports visually engaging report for students.
- infographic, presentation & report templates, charts
- browser-based
- JPEG, PNG, PDF, PPTX
- free plan, pro features via subscription
Visit Piktochart  Report Error
Report Error
Tags:
Piktochart Alternative Tools

Genspark helps you research, analyse, and create structured content faster by combining AI search, summarisation, and writing into a single...
AI Blog Tools
1

Task


Descript AI makes audio and video editing intuitive by letting you cut, clean up and enhance content simply by editing...
Edit Videos
1
Task

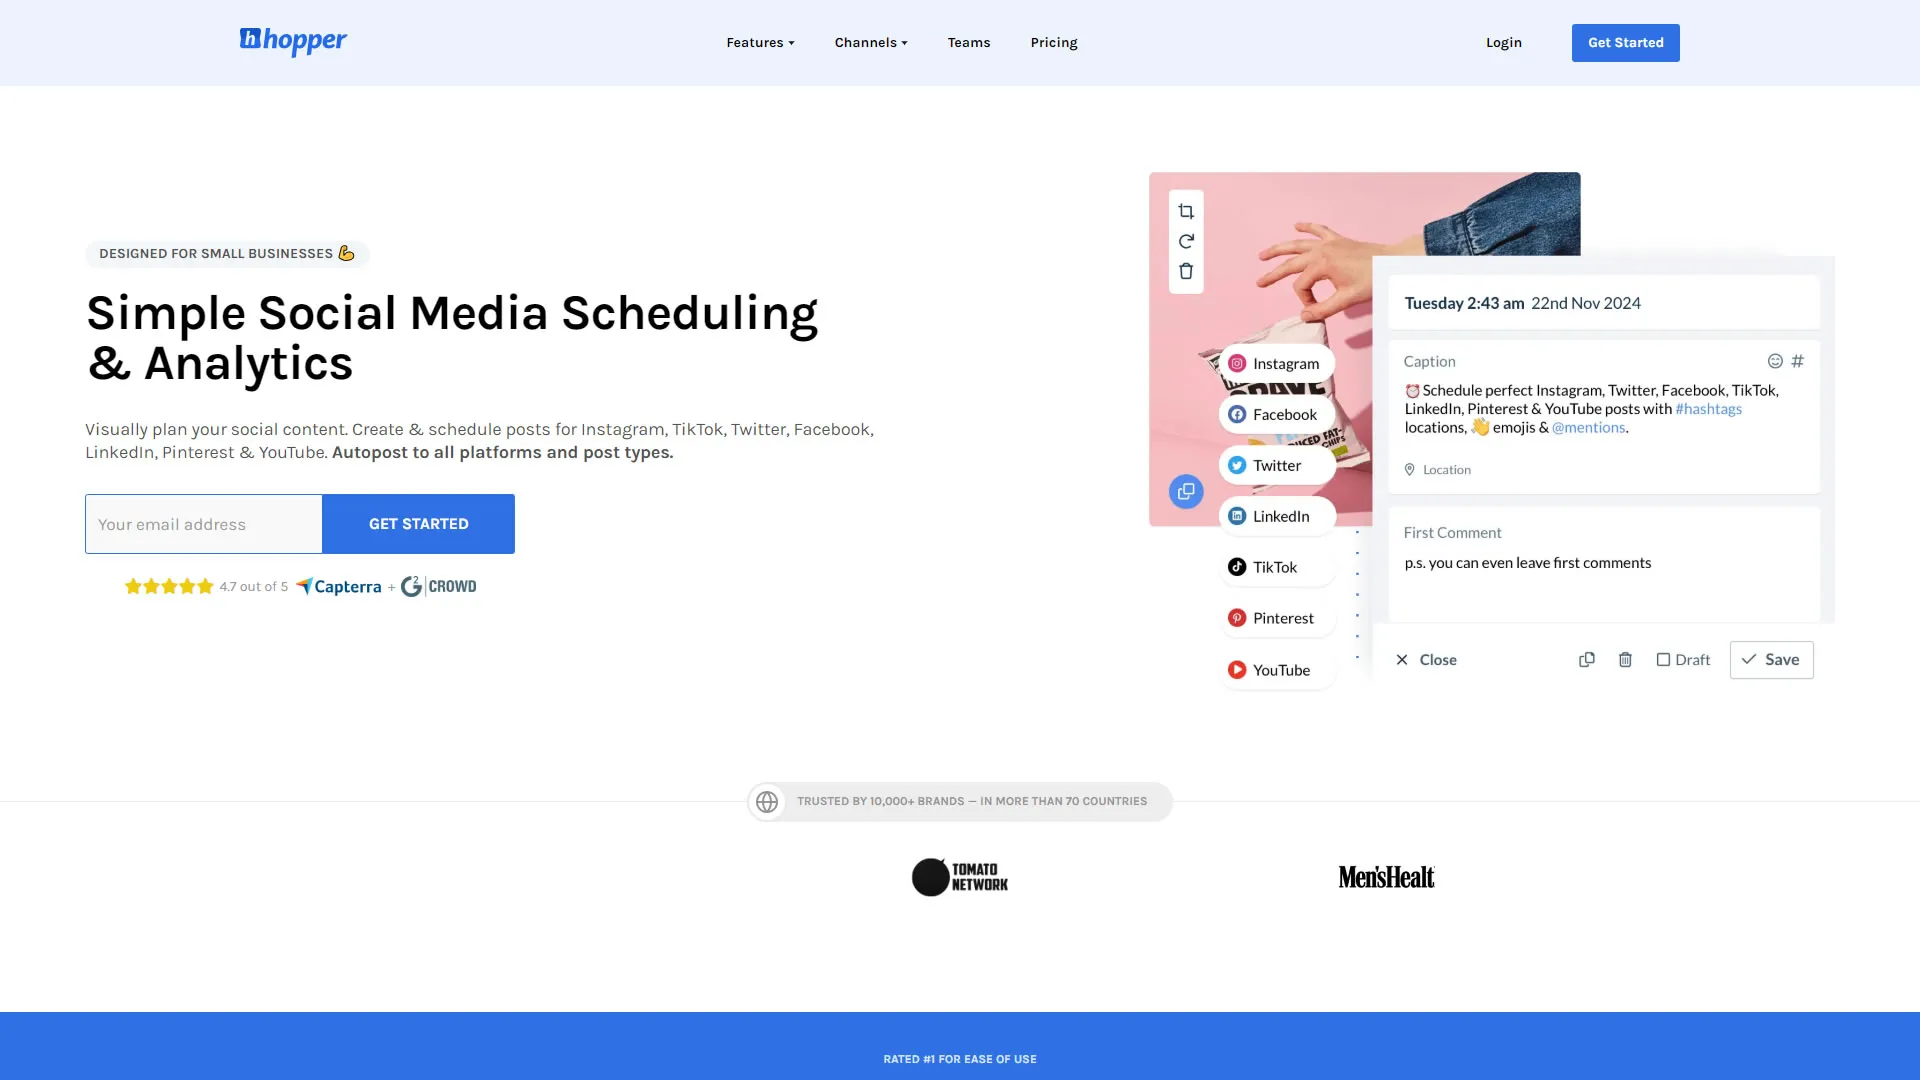
Hopper HQ lets you plan, schedule and auto-publish social media posts across major platforms from one intuitive dashboard, saving...
Task


Real‑time transcription and highlight capture tool for meetings across Zoom, Meet and Teams...
Task
Genspark helps you research, analyse, and create structured content faster by combining AI search, summarisation, and writing into a single...
AI Blog Tools
1
Task
Descript AI makes audio and video editing intuitive by letting you cut, clean up and enhance content simply by editing...
Edit Videos
1
Task
Hopper HQ lets you plan, schedule and auto-publish social media posts across major platforms from one intuitive dashboard, saving...
Task
Real‑time transcription and highlight capture tool for meetings across Zoom, Meet and Teams...
Task
Total Reviews: 0
Average Rating
